- Published:
Allogenic and autogenic processes combined in the formation of shallow-water carbonate sequences (Middle Berriasian, Swiss and French Jura Mountains)
Swiss Journal of Geosciences volume 104, pages 299–322 (2011)
Abstract
Sediment production and accumulation on shallow carbonate platforms are controlled by allogenic, externally controlled processes (such as sea level, climate, and/or platform-wide subsidence patterns) as well as by autogenic factors that are inherent to the sedimentary system (such as lateral migration of sediment bodies). The challenge is to determine how and in which proportion these processes interacted to create the observed sedimentary record. Here, a case study of Middle Berriasian, shallow-marine carbonates of the Swiss and French Jura Mountains is presented. Based on vertical facies evolution and bedding surfaces, different orders of depositional sequences (elementary, small-scale, medium-scale) have been identified in the studied sections. The hierarchical stacking pattern of these sequences and the time span represented by the investigated interval imply that eustatic sea-level fluctuations in the Milankovitch frequency band were an important controlling factor. The small-scale and medium-scale sequences relate to the 100 and 400-kyr orbital eccentricity cycles, respectively. The elementary sequences are attributed to the 20-kyr precession cycle. Differential subsidence additionally produced accommodation changes. The present study focuses on one specific small-scale sequence situated at the base of the transgressive systems tract of large-scale sequence Be4, which is identified also in other European basins. This small-scale sequence has been logged in detail at eight different outcrops in the Jura Mountains. Detailed facies analysis reveals that different depositional environments (tidal flats, internal lagoons, open lagoons, carbonate sand shoals) were juxtaposed and evolved through time, often shifting position on the platform. The boundaries of the small-scale (100-kyr) sequence can be followed over the entire study area and thus must have formed through predominantly allogenic processes (eustatic sea-level fall, the effect of which was locally modified by differential subsidence). In two sections, five well-developed elementary sequences constitute the small-scale sequence. In the other sections, the identification of elementary sequences often is difficult because sedimentation was dominated by autogenic processes that overruled the influence of sea-level fluctuations. In low-energy, tidal-flat and internal-lagoonal settings, orbitally induced sea-level changes were recorded more faithfully, while high-energy shoals were mainly submitted to autogenic processes and the allogenic signal is masked. Consequently, the studied Jura platform experienced a combination of auto- and allogenic processes, which created a complex facies mosaic and a complex stacking of depositional sequences. Nevertheless, the 100-kyr orbital signal was strong enough to create correlatable sequence boundaries. Within a 100-kyr sequence, however, the unambiguous definition of sequences related to the 20-kyr orbital cycle is often difficult and the prediction of their lateral or vertical facies evolution impossible.
1 Introduction
Sedimentary rocks are commonly composed of beds and bed-sets, and the challenge is to determine the factors responsible for such stacking patterns: are they the result of localized and random processes, or are there quantifiable controlling mechanisms that affected the entire sedimentary system on a regional scale? Beds are recognizable because there are facies and/or diagenetic contrasts that define their surfaces. Bed-sets are composed of vertically stacked beds and commonly also exhibit characteristic facies evolutions and characteristic surfaces. This implies that a mechanism must have existed that led to repeated changes in facies and/or diagenetic conditions. Controlling factors affecting a given sedimentary system can be of global, regional, or local nature, and they can be episodic or periodic (Einsele et al. 1991). Because every sedimentary system reacts differently to a given set of factors, it is impossible to propose a general rule.
In the present paper, we concentrate on a shallow, subtropical carbonate platform of Berriasian (Early Cretaceous) age, which crops out in the Swiss and French Jura Mountains. Based on detailed facies analysis as well as on sequence- and cyclostratigraphic interpretations we attempt to differentiate between processes that were controlled by factors external to the studied sedimentary system (allogenic) and factors controlled by processes within the sedimentary system (autogenic). If these processes are repetitive in time, we speak of allocyclic and autocyclic processes, respectively.
1.1 Allocyclic processes
A common allocyclic control is due to eustatic sea-level variations, which result from the combination of long-term changes in ocean-basin volume and climatically induced high-frequency climate changes (Vail et al. 1991). Also repetitive changes in subsidence rate related to tectonic processes that affect the entire platform are considered an allocyclic factor (Cisne 1986; Bosence et al. 2009). Eustatic sea level and subsidence generate the accommodation that, together with the sediment supply, controls the formation of depositional sequences (Schlager 1993). On shallow platforms where carbonate productivity is high, the accommodation space is commonly filled up rapidly, leading to sequences dominated by a shallowing-up facies evolution (Jones and Desrochers 1992; Pratt and James 1992). In the Berriasian of the Swiss and French Jura, the vertical facies evolution of the depositional sequences indicates that they have been at least partly controlled by relative sea-level fluctuations (i.e. accommodation changes). Many of these sequences can be followed over 150 km, implying a regional control on their formation. Furthermore, they display a stacking pattern that reflects the hierarchy of Milankovitch cycles (Strasser 1988; Pasquier 1995; Hillgärtner 1999; Tresch 2007). During Berriasian times, ice in high latitudes probably was present, but ice-volumes were not sufficient to induce important (tens of meters) glacio-eustatic fluctuations, although volume changes of alpine glaciers could have made a small, meter-scale contribution (Fairbridge 1976; Frakes et al. 1992; Eyles 1993; Valdes et al. 1995). Eustatic sea-level changes could also have been created by thermal expansion and contraction of the uppermost layer of ocean water (Gornitz et al. 1982) or by thermally induced volume changes in deep-water circulation (Schulz and Schäfer-Neth 1997). In any of these scenarios, climate is an important controlling factor. Thus, it can be assumed that Berriasian high-frequency sea-level changes were at least partly coupled to variations of insolation, which itself is linked to the orbital parameters of the Earth (Berger et al. 1989). In addition, climate controls water temperature and oceanic circulation, which then influence the ecology of carbonate-producing organisms and thus sediment supply. Rainfall in the hinterland controls the input of siliciclastics and nutrients onto the platform, which again influence the ecosystems and create facies changes.
Miall (1997) has summarized the requirements for identifying an orbital control on the sedimentary record: wide, lateral persistence of the depositional sequences, persistent regularity in the hierarchical stacking pattern, bracketing of the studied interval by numerical ages, and correspondence of the estimated periodicities to those of the orbital cycles. Spectral analyses may be useful to test for hierarchical periodicities (e.g., Weedon 2003). In the present case, however, such methods have not been applied: the large lateral and vertical heterogeneity of the facies, variable sedimentation rates, and erosion or non-deposition precluded the recording of a time series where the evolution of bed thicknesses and facies can be analysed with confidence.
1.2 Autocyclic processes
Autocyclic processes are inherent to the depositional system. They include progradation or lateral migration of sedimentary bodies such as tidal flats, shoals, or delta lobes, creating shallowing-up facies trends (Ginsburg 1971; Pratt and James 1986; Cloyd et al. 1990; Satterley 1996). Burgess and Wright (2003) and Burgess (2006) showed by forward modeling that also changes in carbonate production rate and changes in sediment transport direction through time can create complex and repetitive stratal patterns. These processes are independent of eustasy and/or platform-wide subsidence but depend on local ecological parameters, current patterns, channel migration, or lobe switching. Consequently, the stacking of beds resulting from autocyclic processes will display a disordered pattern, or an ordered pattern but with limited lateral consistency (Drummond and Wilkinson 1993; Wilkinson et al. 1996; Lehrmann and Goldhammer 1999; Burgess 2006).
Shallow carbonate platforms commonly exhibit a pronounced lateral heterogeneity where coral reefs, oolitic or bioclastic shoals, lagoons, and tidal flats are juxtaposed (facies mosaic; Rankey 2002; Wright and Burgess 2005). In such systems, autogenic and autocyclic processes are common, and also events such as storms will leave their impact. Nevertheless, eustatic sea-level changes and subsidence control the accommodation within which the sediment is accumulated, and climate has an influence on the sediment type and storm frequency. It is therefore the combination of autogenic/autocyclic and allogenic/allocyclic processes that is responsible for sediment deposition and the formation of the final sedimentary record. Many case studies have already shown and discussed the coexistence of autocyclic and allocyclic processes, for example: Sami and James (1994) in the Proterozoic of northwest Canada; Jiang et al. (2003) in the Proterozoic of the Lesser Himalaya; Adams and Grotzinger (1996) in the Middle Cambrian of California; Cowan and James (1993) in the Late Cambrian of Newfoundland; Smith and Read (2001) in the Mississippian of Illinois; Yang et al. (1998) in the Late Pennsylvanian and Early Permian of Texas; Bádenas et al. (2010) in the Sinemurian of Spain; Carpentier et al. (2010) in the Oxfordian of France; Sattler et al. (2005) in the Barremian and Aptian of Oman; Lehmann et al. (1998) in the Barremian to Albian of northeastern Mexico; Rankey (2002) in the Holocene of the Bahamas.
There is no reason to believe that orbital forcing was not active during the Early Cretaceous. We thus assume as a working hypothesis that low-amplitude, high-frequency climatic and sea-level fluctuations occurred in the Milankovitch frequency band. The question is how these fluctuations have been recorded on the Jura platform and to what extent they have been overprinted and masked by autocyclic processes. With the present study we focus on the anatomy of one small-scale (100-kyr) depositional sequence and demonstrate how autogenic and allogenic processes interacted in space and in time, and this with a time resolution of a few ten-thousand years.
2 Palaeogeographic and stratigraphic setting
The studied sections are located in the central and southern Jura Mountains along the border of western Switzerland and eastern France (Fig. 1). The Jura mountain chain formed during a late Alpine phase (Miocene and Pliocene) in relation with the orogenesis of the Alps (Trümpy 1980). Palaeogeographically, the Jura platform was situated between the northern margin of the western Tethys Ocean and the Paris Basin (Fig. 2). The tectonic regime was extensional, creating a series of tilted blocks with different subsidence rates (Wildi et al. 1989). Shallow, episodically emergent areas alternated with shallow epicontinental basins (Gygi and Persoz 1986; Allenbach 2002). Palaeolatitude was approximately 25–30°N, placing the platform in a subtropical climate belt (Ziegler 1988; Dercourt et al. 2000). For the Middle Berriasian, a change from a semi-arid, Mediterranean-type climate to more humid conditions has been postulated for Central Europe mainly based on clay mineralogy (Deconinck 1987; Hallam et al. 1991; Pasquier 1995). This climate shift may have been related to changes of surface currents on the European archipelago and to the opening of the proto-North Atlantic Ocean (Abbink et al. 2001; Mutterlose et al. 2003). On the shallow Jura platform, organic and inorganic carbonate productivity was generally high, producing lagoonal and peritidal facies as well as bioclastic and oolitic shoals and coral patch reefs (Pasquier 1995; Hillgärtner 1999; Tresch 2007). Quartz sand and clays were periodically washed into these environments from the emergent massifs in the hinterland (Fig. 2).

Location of studied sections (Sw.: Switzerland)

Palaeogeographic position of the Jura platform and the Vocontian basin (based on Dercourt et al. 2000)
The latest Jurassic and earliest Cretaceous in Europe are characterized by a long-term regressive sea-level trend (e.g., Haq et al. 1987; Hardenbol et al. 1998; Aurell et al. 2003). On the Jura platform, this regressive phase is expressed by the peritidal to supratidal facies of the Early Berriasian Goldberg Formation (“Purbeckian”; Häfeli 1966; Strasser 1988; Fig. 3). In the Middle Berriasian, the Jura platform experienced a significant transgression, which resulted in the deposition of the shallow-marine sediments of the Middle to Late Berriasian Pierre-Châtel Formation (Steinhauser and Lombard 1969). High-frequency, low-amplitude eustatic sea-level fluctuations were superimposed on this long-term sea-level trend (Pasquier 1995; Hillgärtner 1999; Tresch 2007; Tresch and Strasser 2010).

Chrono-, sequence-, bio-, and lithostratigraphy for the Berriasian. Sequence-chronostratigraphy and ammonite zones after Hardenbol et al. (1998), charophyte and charophyte-ostracode zones after Mojon (2002), formations according to Pasquier (1995) and Tresch (2007). The exact correlation between the charophyte zones of Mojon (2002) and the ammonite subzones of Hardenbol et al. (1998) is uncertain in places. Jac.: Jacobi; Priv.: Privasensis
2.1 Biostratigraphy
The base of the Pierre-Châtel Formation has been dated by ammonites. It is placed in the Privasensis ammonite subzone (Clavel et al. 1986; Fig. 3). For the sections of the Jura platform, a biostratigraphy based on charophyte-ostracode assemblages has been established for the Goldberg, Pierre-Châtel, and Vions formations by Mojon and Strasser (1987), Détraz and Mojon (1989), and Mojon (2002). Moreover, the top of the Pierre-Châtel and the base of the Vions formations contain the benthic foraminifera Pseudotextulariella courtionensis and Pavlovecina allobrogensis (Fig. 5). These two species have a limited biostratigraphical range and are attributed to the Paramimounum ammonite subzone (Clavel et al. 1986). In order to additionally constrain the biostratigraphy of the platform sections, correlations with hemipelagic sections of the Vocontian Basin have been performed (Pasquier and Strasser 1997; Hillgärtner 1999; Strasser et al. 2004). These sections are well dated by ammonites and calpionellids (Le Hégarat 1973; Jan du Chêne et al. 1993; Fig. 5).
2.2 Definition of depositional sequences
Depositional sequences in the studied sections are identified according to their vertical facies evolution and their bounding surfaces (Tresch 2007; Tresch and Strasser 2010). They may consist of one or of several beds that are visible in the outcrop. Bed limits are marked by marly layers or by thin marly seams. Facies evolution commonly displays a thin deepening-up interval, followed by a prominent shallowing-up interval, locally terminating with intertidal to supratidal features such as birdseyes or circumgranular cracks. However, also aggradational sequences with no apparent facies change occur. These are, however, delimited by marly layers that contain reworked material and/or freshwater flora. The smallest unit (composed of one or several beds) that implies a deepening trend followed by a shallowing trend is called elementary sequence. In the studied sections, elementary sequences measure between 10 cm and 2 m. They stack into small-scale sequences, which again display a general deepening-shallowing facies evolution, and these finally compose medium-scale sequences. One or several medium-scale sequences correspond to the “third-order” sequences defined by Hardenbol et al. (1998) in European basins (Strasser et al. 2000). Independent of scale, these sequences are here analyzed with the sequence-stratigraphic approach (Posamentier et al. 1988; Mitchum and Van Wagoner 1991; Catuneanu 2006). Elementary and small-scale sequences are thus not treated as “parasequences” bounded by flooding surfaces because they contain sequence-stratigraphic elements that allow for a higher-resolution analysis (Strasser et al. 1999; see interpretations below).
2.3 Sequence-stratigraphic framework
Sequence- and cyclostratigraphical analyses of Berriasian platform and basin sections have been performed by Pasquier (1995), Pasquier and Strasser (1997), Hillgärtner (1999), Strasser et al. (2004), Tresch (2007), and Tresch and Strasser (2010). The limit between the Goldberg and the Pierre-Châtel formations is characterized by erosion surfaces, reworked pebbles, and freshwater flora, implying an emergence of the platform. According to Clavel et al. (1986), the Subalpina ammonite subzone is missing. This hiatus is associated with sequence boundary Be4 of Hardenbol et al. (1998) who established a sequence-chronostratigraphic chart for European basins (Fig. 3). In some platform sections, this hiatus also includes sequence boundary Be3 (Tresch 2007). In the Vocontian Basin, sequence boundary Be4 is marked by a rapid change from thinly-bedded to thickly-bedded limestone-marl alternations at the base of the Privasensis subzone (Montclus section in Fig. 5). The following interval with irregular, thick limestone beds and mudflow conglomerates (in bundle 3) is interpreted as lowstand deposits (Jan du Chêne et al. 1993). The top of the Pierre-Châtel Formation corresponds to sequence boundary Be5 in the Paramimounum subzone (Chapeau de Gendarme section in Fig. 5). At Montclus, this sequence boundary is indicated by the base of a slumped interval (lowstand deposit). Marl-dominated intervals in the hemipelagic sections are interpreted as condensed sections that formed when pelagic carbonate productivity and/or input of carbonate mud from the platform were reduced (Pasquier and Strasser 1997; Pittet et al. 2000). At Montclus, three such intervals can be recognized. The uppermost one lies in the Paramimounum subzone and thus may correspond to the maximum flooding indicated by Hardenbol et al. (1998; Fig. 3).
The numerical ages of sequence boundaries Be4 and Be5 were interpolated by Hardenbol et al. (1998), based on the ages of the lower and upper limits of the Berriasian stage proposed by Gradstein et al. (1995): 144.2 ± 2.6 and 137.0 ± 2.2 Ma, respectively. In the meantime, Gradstein et al. (2004) revised these values to 145.5 ± 4.0 and 140.2 ± 3.0 Ma. The numbers in Fig. 3 were taken from Hardenbol et al. (1998), but considering the shorter duration of the Berriasian as suggested by Gradstein et al. (2004) and reiterated by Ogg et al. (2008), the interval between sequence boundaries Be4 and Be5 might actually be somewhat shorter.
2.4 Cyclostratigraphy
In contrast to the shallow-marine sections of the Jura platform, the regular stacking of limestone-marl alternations and the absence of erosion surfaces suggests that the sedimentary record of the hemipelagic Montclus section (Fig. 5) is complete and that the entire time interval between sequence boundaries Be4 and Be5 is represented. In this section, 72–104 limestone-marl couplets are counted (depending on interpreting the thin marly limestones as part of a couplet or a couplet itself). These group into 19 bundles of 2–8 couplets, each bundle starting with a thick limestone bed and commonly showing a trend of thinning-up of the beds (except for number 19, which is a thick limestone bed overlying a soft, vegetation-covered interval; Fig. 5). The three clay-rich beds that are mostly covered by vegetation are interpreted as condensed sections where carbonate input has been strongly reduced.
Accepting the age of Be4 at 141.0 and of Be5 at 139.3 Ma, the duration of a couplet would thus be between 24 and 16 kyr. This and the observed bundling suggests that the couplets could be related to the orbital precession cycle of 20 kyr, and the bundles to the short eccentricity cycle of 100 kyr (Berger et al. 1989; Strasser et al. 2006). The fit is not perfect: 19 bundles imply a duration of 1.9 myr, whereas the interval between Be4 and Be5 is estimated at 1.7 myr by Hardenbol et al. (1998) and possibly was even shorter if considering the new dating by Gradstein et al. (2004). Also the position of the condensed section in bundle 18 versus the maximum-flooding surface at 139.6 Ma (according to Hardenbol et al. 1998) is off by 200 kyr (Fig. 3). These discrepancies may be explained by a misinterpretation of the couplets and the bundling, by inaccuracies in numerical dating and interpolation, and/or by the fact that the best-developed physical expression of a sequence boundary or maximum-flooding surface does not necessarily occur at the same time in different palaeogeographic positions (Montañez and Osleger 1993; Jacquin and De Graciansky 1998; Strasser et al. 2000).
The cyclostratigraphical interpretation of the Berriasian platform sections is difficult to constrain with precision by biostratigraphy because ammonites are rare. The charophyte-ostracode and foraminifer assemblages indicate the ammonite subzone but do not define the subzone boundaries. However, the bundling of the depositional sequences is clearly expressed: on average, 5 elementary sequences group into a small-scale sequence. Similar patterns of hierarchical stacking of depositional sequences have also been observed in the Late Jurassic of the Jura platform (e.g., Pittet and Strasser 1998; Colombié and Rameil 2007). The studies of Pasquier (1995), Hillgärtner (1999), and Tresch (2007) have led to a consistent sequence- and cyclostratigraphic interpretation of the Middle to Late Berriasian of the Jura platform. The example shown in Fig. 5 implies that the lowstand deposits of sequence Be4 are missing or extremely reduced on the Jura platform, while they accumulated in the Vocontian Basin as limestone-marl alternations (bundles 1–10). This interpretation is confirmed by the missing Subalpina ammonite subzone on the platform (Fig. 3; Clavel et al. 1986). The rapid change from thicker to thinner limestone beds in bundle 11 at Montclus is seen as a transgressive surface, which would correspond to the transgressive surface at the base of the Pierre-Châtel Formation on the platform. The condensed section between bundles 18 and 19 at Montclus then corresponds to the end of a thickening-up trend of small-scale sequences in the Chapeau de Gendarme section, which implies the maximum of gain in accommodation on the platform. It is therefore assumed as a working hypothesis that a limestone-marl couplet in the basin corresponds to an elementary sequence on the platform, and a bundle of limestone-marl couplets to a small-scale sequence (Pasquier and Strasser 1997).
Based on this framework, we consider the elementary sequences as being related to the orbital precession cycle (20 kyr) and the small-scale sequences to the short eccentricity cycle (100 kyr). The medium-scale sequences related to the long eccentricity cycle (400 kyr) cannot be seen in the example of Fig. 5 but have been interpreted in other Berriasian sections not illustrated here (Pasquier 1995; Strasser and Hillgärtner 1998; Hillgärtner 1999). The 40-kyr obliquity cycle could not be identified. In the following, the focus will be set on small-scale sequence 13 in the sections of the Jura platform, which is part of the transgressive systems tract of sequence Be4 (Fig. 5). During this long-term transgression, accommodation on the shallow platform increased and allowed for a relatively complete sedimentary record, even if high-frequency sea-level drops and/or tectonic uplift locally have caused non-deposition and erosion.
3 Studied sections
Sequence boundary Be4 and the following transgressive interval have been documented by Tresch (2007) by means of 11 sections, which were logged in great detail. For the purpose of the present paper, only eight sections are presented, and the focus is set on the lateral correlation of only one small-scale sequence (small-scale sequence 13; see below). The Rusel section is used as an example of facies description and interpretation, and of sequence-stratigraphic analysis (Fig. 6). The other sections have been treated in the same way but are not discussed here in detail. Facies analysis and interpretation of the depositional environments of all 11 sections are based on a total of 169 section meters, 666 thin sections, and 75 marl washings (Table 1; Tresch 2007). Criteria to interpret sequence boundaries, transgressive surfaces, and maximum-flooding intervals or surfaces are summarized in Table 2. The legend of symbols used in the sections is given in Fig. 4.

Legend for the studied sections and models
3.1 Rusel section: sedimentological interpretation
The Rusel section is situated in a small abandoned quarry above Lake Biel (Fig. 1), next to the highway between Biel and Tüscherz (Swiss coordinates 582.620/219.320). At the base of the section, fossil-poor mudstones with birdseyes and some ostracodes are interpreted as having formed in a tidal-flat environment. Features such as circumgranular and desiccation cracks point to increased subaerial exposure of the tidal flat towards the top the Goldberg Formation. A marl bed between thin mudstone layers at the top of the Goldberg Formation is rich in charophytes and ostracodes. These marls are interpreted as freshwater-pond deposits. According to Pasquier (1995), they lie in the charophyte-ostracode assemblage zone M1b.
Massive ooid-rich wacke- to packstone beds (internal-lagoonal deposits) mark the base of the Pierre-Châtel Formation. The first bed can be followed laterally over some 150 m, and its thickness changes by several tens of centimeters. This is probably due to the development of a relief during the emergence of the top of the Goldberg Formation. The local occurrence of intraformational conglomerates at the transition from the Goldberg to the Pierre-Châtel Formation is interpreted as lag deposits at the beginning of a major transgression (Häfeli 1966). At the top of the first bed, birdseyes and desiccation cracks indicate tidal-flat deposits. The association of charophytes (stems and gyrogonites) with marine constituents (foraminifera) in the following thin marl layer points to reworking of lacustrine deposits during a marine transgression. A massive ooid-rich bed overlies the marls.
At 1.25 m, a karst surface with up to 8 cm relief caps this massive bed. It is covered by tidally influenced internal-lagoonal deposits exhibiting lenticular and flaser bedding. A deepening of the system is suggested by the deposition of laminated, ooid-rich internal-lagoonal sediments. The change to low-energy conditions (wackestones) is interpreted as increased deepening and/or protection of the depositional environment. High-energy conditions are reflected by the deposition of two ooid-rich pack- to grainstone beds (from 1.40 to 1.75 m). The first bed is characterized by reactivation surfaces, which have been created by changing (tidal?) currents. This bed pinches out laterally and is interpreted as a high-energy shoal deposited in a restricted, internal-lagoonal setting. A thin marl layer separates the two massive beds. Because it is intercalated between two thick beds it must have formed when accommodation was high. Therefore, it is considered to represent condensed low-energy sediments, which have been deposited during a deepening of the system (Strasser and Hillgärtner 1998). The second ooid-rich bed is characterized by lamination. This is related to an increase of water energy during a shallowing of the depositional environment, possibly up to a beach (however, no keystone vugs have been found). A decrease of energy is implied by the following wackestone bed (from 1.75 to 1.90 m). A deepening of the depositional environment and/or local protection from currents behind shoals may have led to this drop in water energy. Lamination at the top to the following massive bed again indicates higher energy in shallower water. The thin marl layer overlying an erosion surface is considered to represent tidal-flat deposits (at 2.10 m). The following thick, ooid-rich wacke- to packstone is interpreted as an interval of restricted internal-lagoonal deposits. At its base, a grainstone interval containing intraclasts points to an increase of energy. It reflects an increase of tidal activity and/or a storm event. The deposition of charophyte gyrogonites at the top of this bed points to a gradual shoaling (from 2.40 to 2.50 m). The following beige-brownish marls indicate reduced water circulation in a restricted, lagoonal environment.
A gradual increase of siliciclastics characterizes the nodular interval from 2.55 to 3.00 m. At the top of this bed, circumgranular cracks indicate emergence. The overlying charophyte- and ostracode-rich marls point to freshwater conditions (assemblage zone M4; Pasquier 1995).
During an opening of the system to marine conditions, thick shoal beds with reactivation surfaces were deposited. A reddish karst surface at the top of this interval (at 3.90 m) points to an important relative sea-level drop resulting in subaerial emergence. The following marl interval displays low-energy conditions probably due to protection behind a shoal field. The section then continues with internal-lagoonal deposits building up thick beds (Pasquier 1995).
The Rusel section contains the highest amount of siliciclastics of all the measured sections (up to 30% in the interval from 2.65 to 3.10 m). This implies a relatively proximal position of this section on the Jura carbonate platform, close to the emerged hinterland.
3.2 Rusel section: sequence-stratigraphic interpretation
Dating by charophyte-ostracode assemblages of the upper part of the Goldberg Formation suggests a close stacking of major sequence boundaries (Be2 to Be4; Fig. 3) related to non-deposition and reworking on the partly emergent platform top. The base of the Pierre-Châtel Formation then represents an important transgressive surface. The platform-to-basin correlation (Fig. 5) suggests that 10–11 small-scale sequences (corresponding to 1–1.1 million years) are missing between sequence boundary Be4 and this transgressive surface (Fig. 6).

Sequence-stratigraphic and cyclostratigraphic platform-to-basin correlation of the Be4 sequence (G.: Goldberg). For explanations refer to text. Legend of symbols is given in Fig. 4. M3, M4: charophyte-ostracode zones of Mojon (2002; Fig. 3), in parenthesis if reworked. Logs modified from Hillgärtner (1999)

Three small-scale sequences have been identified in the lower part of the Pierre-Châtel Formation. They are all delimited by well-expressed emergence features interpreted as small-scale sequence boundaries. Comparing the facies evolution and the stacking pattern of this section with the other sections on the Jura platform, it is assumed that at Rusel one small-scale sequence is missing at the base of the Pierre-Châtel Formation (small-scale sequence 11; Tresch 2007; Tresch and Strasser 2010). Moreover, only two elementary sequences of small-scale sequence 12 are present at Rusel: they have not been deposited due to lack of accommodation, or were deposited but then eroded.
Small-scale sequence 13 consists of 5 elementary sequences (the field aspect of 4 of these is illustrated in Fig. 7). The first elementary sequence is composed of tidal-flat to internal-lagoonal deposits and displays a strongly reduced thickness when compared to the overlying ones. A maximum-flooding surface is tentatively placed at the bioturbated top of the limestone bed with flaser bedding. The directly overlying marls with lenticular bedding would then represent the early highstand, during which siliciclastics prograded into the lagoon. The overlying bed with flaser bedding would represent the initial transgression of the second elementary sequence, which was then overridden by the high-energy shoal. The surface at the top of this bed reflects an environmental change from shallow, high-energy (shoal bed) to relatively deeper, low-energy deposits (thin marl layer). This layer is considered to represent the maximum flooding of the second elementary sequence.

Photograph of part of the Rusel section, with interpretation of 4 elementary sequences within small-scale sequence 13. Hammer for scale. Solid lines sequence boundaries; dashed lines maximum-flooding surfaces. Compare with Fig. 6
The third elementary sequence consists of two beds representing restricted, internal-lagoonal deposits. Its maximum flooding is assumed to be located around the thin marly joint, which separates these two beds. The thin marl layer (tidal flat deposits with channeling) at the top of the second bed indicates the sequence boundary of the fourth elementary sequence. The bioturbated interval at the top of the massive bed is considered as maximum flooding. It is directly followed by the beige-brownish, restricted internal-lagoonal marls, which are thought to represent the sequence boundary of the fifth elementary sequence. The increasing amount of siliciclastics in this sequence may indicate progressive erosion of siliciclastics in the nearby hinterland during falling relative sea level, and/or a change to a more humid climate. Bioturbation at the top of the nodular bed is interpreted as the maximum-flooding interval of the fifth elementary sequence as well as of small-scale sequence 13 (this position is suggested by lateral correlation; see below).
This maximum-flooding interval is immediately overlain by the boundary of small-scale sequence 14, where circumgranular cracks superimposed onto the bioturbated sediments suggest emergence due to a relative sea-level fall (Strasser 1991). Highstand deposits are missing. This pronounced asymmetry of small-scale sequence 13 (and also of elementary sequences 4 and 5) is explained by the superposition of high-frequency sea-level fluctuations on a rapid long-term sea-level rise (see below, Fig. 12).
The transgressive deposits of small-scale sequence 14 consist of high-energy shoal deposits. A sequence-stratigraphic interpretation is not possible because no facies trends are discernible. The upper boundary of this small-scale sequence is well-marked by a reddish karstified surface. Lateral correlation with other sections on the Jura platform shows that this karst is limited to Rusel. It is therefore implied that there must have been local tectonic uplift in the Rusel area (Pasquier 1995; Tresch 2007).
3.3 Other sections
The following other sections have been used for this work (Fig. 1). They have been analyzed and interpreted in the same way as Rusel.
-
Marchairuz: along the road just north of Marchairuz pass (Swiss coordinates 508.870/156.460);
-
St. Claude: along the road between St. Claude and Cinqétral (French coordinates 872.280/2164.125);
-
Lavans: along the road just west of the village of Lavans lès St. Claude (French coordinates 864.350/2159.600);
-
Chapeau de Gendarme (Fig. 8): along the road between St. Claude and Septmoncel (French coordinates 874.550/2157.075);
Fig. 8 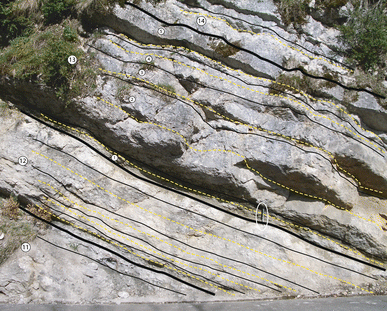
Photograph of part of the Chapeau de Gendarme section, showing small-scale sequences 12 and 13 and their elementary sequences. Hammer for scale. Solid lines sequence boundaries; dashed lines maximum-flooding surfaces. Compare with Fig. 5
-
Crozet: along the forest road above the villages of Villeneuve and Crozet (Swiss coordinates 487.750/125.660);
-
Poizat: along the road between the villages of Poizat and Le Replat (French coordinates 858.870/2132.320);
-
Yenne: along the road west of Yenne (French coordinates 865.470/2084.050).

4 High-resolution sequence-stratigraphic interpretation and correlation
Sequence-stratigraphic surfaces and intervals separate older from younger strata but are in many cases time transgressive (e.g., Catuneanu 2006). On a shallow carbonate platform, emergence and karstification can create significant relief (sequence boundary), which is filled step-wise during the following transgression (transgressive surface). The best chance to approach isochrony is during maximum flooding (maximum-flooding surface or interval) when sea-level rise outpaces sediment accumulation and the entire platform is covered with water (Sandulli and Raspini 2004). However, even then locally different sedimentation rates may lead to compartmentalization, and the relatively deepest facies or the relatively highest accommodation gain may occur at different times in different locations. Consequently, the correlation lines between the sections in Fig. 9 are not strictly isochrones but rather represent time spans within which a surface or interval formed. In the case of small-scale (100-kyr) sequences, this interval may include several tens of thousands of years if one or more elementary sequences are missing due to non-deposition or erosion. Elementary sequences that show no emergence features may actually cover the entire 20 kyr of a precession cycle, but sedimentation rates may have varied significantly throughout the time of deposition. Elementary sequences having a lag deposit at their base and emergence features at their top may represent only a fraction of this time (Strasser and Samankassou 2003).


Correlation scheme of the eight studied sections. For explanations refer to text. Legend of symbols is given in Fig. 4
4.1 Small-scale sequence 13
The base of small-scale sequence 13 is characterized by karst, circumgranular cracks, birdseyes, and/or lacustrine facies in several sections, thus clearly indicating inter- to supratidal conditions (Rusel, St. Claude, Chapeau de Gendarme, Crozet, Poizat; Fig. 9a, b). In the other sections, the sediment surface stayed subtidal. The top of this small-scale sequence displays circumgranular cracks at Rusel, birdseyes at Chapeau de Gendarme and an irregular reddish surface at Yenne, but no signs of subaerial emergence in the other sections. However, directly below this small-scale sequence boundary, strong bioturbation and nodulization are apparent in all sections but Yenne. This is interpreted as a sign of maximum flooding when water was relatively deep and calm and sedimentation rate reduced.
Identification and correlation of the elementary sequence boundaries and maximum-flooding surfaces are based on facies evolution and on bedding surfaces. Clear deepening-shallowing trends of facies are difficult to recognize if no emergence features are present (such as in sequence 4 at Poizat; Fig. 9b). An evolution from higher energy (grainstones and packstones) to lower energy (wackestones and floatstones) and back to higher energy can be seen in some cases (e.g., sequence 4 at Chapeau de Gendarme and Marchairuz).
In most cases, however, we have to rely on marl layers that separate beds and indicate an environmental change. Clays can be washed onto the platform when rainfall increases in the hinterland, when relative sea level drops and forces erosion of soils and progradation of deltas, or when sea level rises and remobilizes clays from flooded coastal areas (Tucker et al. 2009). Also, clays can be ponded in lagoons if water energy decreases. Decrease of water energy may be due to a sea-level rise that puts the sea floor below wave base but also to a sea-level drop that isolates a lagoon behind a barrier (Strasser and Hillgärtner 1998). If charophytes are associated with the marls, then the marl level would indicate a sea-level drop. If marine fauna is associated, the interpretation would tend towards a maximum flooding. Some elementary sequences show a division into a lower limestone part and an upper marl part (e.g., sequence 5 at Marchairuz and Lavans). A possible scenario would be that during transgression the water is devoid of clays and the carbonate factory active, while during regression the clays prograde onto the platform and hamper carbonate production. Nutrients associated with the clays may furthermore amplify this effect (Hallock and Schlager 1986).
The mechanisms invoked above are all of an allocyclic nature, mainly due to sea-level and climate changes. However, intertidal features such as birdseyes can also form through local sediment accumulation up to sea level, and clays can be ponded behind locally formed barriers. In addition, differential subsidence can lead to gain of accommodation in one area and to loss in another. An important criterion for correlating the depositional sequences therefore is their lateral extension.
The intervals where it is possible to correlate the boundaries and maximum-flooding surfaces of elementary sequences have been plotted in a simplified time–space diagram (Fig. 10). Correlatable intervals are supposed to have been at least partly influenced by sea-level fluctuations corresponding to the 20-kyr precession cycle; in non-correlatable, autocyclic intervals this allocyclic signal is hidden and no time control can be inferred. The Rusel and Chapeau-de-Gendarme sections show a clearly structured sedimentary record where the elementary sequences are well developed (subtidal to supratidal deposits). The Yenne section, however, is composed of massive bioclastic beds of homogeneous facies. Only three slightly marly intervals with wavy bedding surfaces subdivide small-scale sequence 13 (Fig. 9b). They probably are indicative of lower sedimentation rates but there are no facies criteria that identify them as being related to sequence boundaries or maximum-flooding intervals.

Simplified time–space diagram of small-scale sequence 13 and its interpreted 5 elementary sequences, outlining correlatable and non-correlatable intervals in the studied sections. SB: sequence boundary; MFS: maximum-flooding surface; Ru: Rusel; Ma: Marchairuz; SC: St. Claude; La: Lavans; CG: Chapeau de Gendarme; Cr: Crozet; Po: Poizat; Ye: Yenne. For discussion see text
By integrating information from facies evolution, bedding planes, and stacking pattern, the correlation of Fig. 9a, b is proposed. While we are confident with the placing of the boundaries of small-scale sequence 13 within the larger framework of the Be4 sequence (Pasquier 1995; Hillgärtner 1999; Tresch 2007), there are many question marks left when it comes to the correlation of the elementary sequences.
5 Discussion
5.1 The making of elementary sequences
If a carbonate factory is healthy, sediment accumulation can easily fill the available space up to the intertidal zone (Kendall and Schlager 1981). Through storms, also the supratidal realm can be nourished by sediment. The resulting shallowing-up sequence thus forms independently of relative sea-level change (Fig. 11). In order to superpose a second sequence, subsidence and/or long-term eustatic sea-level rise must create new accommodation space. Commonly, there is a lag time before carbonate production starts up again after prolonged subaerial emergence (Read et al. 1986; Tipper 1997). Of course, also a drop of relative sea level can put the environment into the intertidal-supratidal zone. Consequently, depositional sequences terminating with intertidal to supratidal deposits can have formed through allocyclic or autocyclic processes (e.g., Burgess 2006; Burgess and Wright 2003). At Poizat, elementary sequences 1 and 2 could thus have resulted from either process (Fig. 9b). However, if relative sea level drops below the sediment surface, the emergence features will be superimposed directly onto subtidal deposits (Fig. 11). This can be observed especially in the Rusel section (Fig. 9a) and is a clear sign for an allogenic process (Strasser 1991).

Creation of shallowing-up sequences at constant sea level and with fluctuating sea level. The resulting sedimentary record represents the evolution through time of one point on the shallow carbonate platform. Subsidence is assumed constant. At constant sea level (a), once sediment has filled in the available space, progradation of tidal flats is initiated. Carbonate production decreases then stops when the adjacent lagoon is filled in. Subsidence creates new accommodation but carbonate productivity picks up only after a lag time. With fluctuating sea level (b), accommodation is created during sea-level rises (in addition to subsidence) but the sediment becomes subaerially exposed during falls, thus superimposing supratidal features onto subtidal and intertidal sediment. Legend of symbols is given in Fig. 4
If the water is very shallow, even minor drops in relative sea level will lead to emergence. In deeper water, however, facies will stay the same or will be influenced only indirectly by a lowered wave base (“subtidal cycles” of Osleger 1991) or by input of siliciclastics eroded and transported from shallower areas. However, fluctuations of the wave base need not be related to sea level but can also result from changes in the energy regime (e.g., opening and closing of passes through barriers protecting lagoons). Also, clay input that creates marl layers in the sedimentary record can be independent of climate and tectonics and related only to changing energy levels. Subtidally formed sequences may also display a deepening-up trend and be limited by condensation surfaces (e.g., Lukasik and James 2003). Condensation may correspond to maximum flooding and thus be controlled by rapid sea-level rise (allogenic), or it may result from a decrease in carbonate productivity related to ecological factors (allogenic and/or autogenic). At Chapeau de Gendarme (Fig. 9b), two marl layers in elementary sequence 2 and one in sequence 4 cannot be attributed to a sequence boundary or a maximum flooding. Consequently, they could have formed through an autogenic process.
On bioclastic or oolitic shoals, reactivation surfaces are common. They are created through lateral migration of these sand bodies under the influence of tidal currents or storms. Such surfaces thus clearly have an autogenic origin (e.g., elementary sequence 2 at Crozet; Fig. 9b). If shoals are abandoned because sea-level rise drowns them or because subaerial emergence exposes them to freshwater diagenesis, the resulting surface must be considered as an allogenic product. On the other hand, if a shoal becomes inactive due to a change in current regime, this can have an auto- or allogenic origin: lateral migration of a barrier may modify the current regime (autogenic), or sea-level drop may cause emergence of a more distal barrier that cuts off the water energy (allogenic). In the case of elementary sequences 1, 2, and 3 at Lavans (Fig. 9a), the placing of sequence boundaries therefore is questionable.
At Rusel, a lower subsidence rate and more clay input apparently allowed recording each low-amplitude sea-level and environmental change. Also Chapeau de Gendarme contains many marl layers and displays all elementary sequences. Poizat is poor in marls but has elementary sequences delimited by birdseyes and microbial mats. At Yenne, low-amplitude sea-level changes did not provoke any facies change and the clays did barely reach this distal position. Consequently, in addition to a general proximal–distal trend from Rusel to Yenne, the Jura platform must have been structured into areas with shallower and deeper water, and clays were better preserved in morphological depressions. Seafloor morphology can be constructed by differential sediment accumulation such as high-energy shoals and/or through differential subsidence.
Differential subsidence is implied by the varying thicknesses of small-scale sequence 13 (Fig. 9a, b). The thickness differences persist also when the sections are decompacted according to facies (Hillgärtner and Strasser 2003; Strasser et al. 2004). Plots showing differential subsidence of the Jura platform throughout the Mesozoic have been calculated by Wildi et al. (1989), and block-faulting in the Palaeozoic basement has been postulated by Allenbach (2002) to explain thickness differences in Oxfordian deposits. Specifically for the Berriasian, Hillgärtner and Strasser (2003) have reconstructed differential subsidence rates varying between 3 and 6 m/100 kyr. No synsedimentary faults have been detected in the studied Berriasian sections. They are hidden beneath the vegetation cover of the Jura Mountains, and/or the seafloor adapted with flexures to the tectonic movements in the basement, thus creating an irregular topography.
When high-frequency sea-level fluctuations are superimposed on a fast long-term sea-level rise, the preservation potential of the sediments is better because more accommodation space is created (Fig. 12). High-frequency sea-level drops, however, are attenuated and the formation of unequivocal sequence boundaries is hampered. If long-term sea-level rise is slow, sequence boundaries are well developed but non-deposition and erosion are common (as in elementary sequence 1 of Fig. 12). Small-scale sequence 13 has been chosen because it is part of the transgressive systems tract of sequence Be4 (Fig. 5). On the 100-kyr scale, the sequence boundaries are well identifiable, whereas on the scale of the elementary, 20-kyr sequences autogenic processes have locally overprinted the allocyclic signal (Fig. 10).

Sketch showing the effect of orbitally-driven high-frequency and short-term sea-level fluctuations superimposed on a long-term transgressive trend. Subsidence is assumed constant through time. The creation of a small-scale sequence composed of five elementary sequences is simulated. Note that the maximum-flooding interval of the small-scale sequence is situated at the end of the thickening-up trend of the elementary sequences, even if a 20-kyr sea-level cycle leads to intertidal conditions with birdseyes at its top. The resulting small-scale sequence is highly asymmetric. Legend of symbols is given in Fig. 4
Figure 13 is a summary sketch evoking the interactions of differential subsidence, eustatic sea-level, climatically and tectonically controlled terrigenous input, and carbonate systems (coastal lakes, tidal flats, protected and open lagoons, barriers; coral reefs have not been included because they do not occur in the studied sections). Expanding this into a 3-dimensional scene that evolves through time, it is evident that the resulting sedimentary record will be a complex mixture of autocyclically and allocyclically generated deposits. In 3-D experiments with siliciclastics, Martin et al. (2009) have shown that with the two external factors sea level and subsidence, an extremely variable pattern of allogenic and autogenic surfaces is created. Carbonate systems are even more complex because living organisms not only produce much of the sediment but can also build up mounds or stabilize the sediment by binding. This adds ecology to the controlling factors, which again is submitted to external controls (water depth, temperature, nutrients, turbidity, chemistry) as well as to intrinsic factors (local environmental conditions, inter-species relations). Burgess and Wright (2003) modeled carbonate systems with migrating islands and lagoons, producing complex and laterally non-persistent depositional sequences.

Schematic cross-section through a shallow carbonate platform structured by block faulting (a). Carbonate particles (ooids, bioclasts) are produced in situ but may be reworked and transported by tidal currents and storms. Terrigenous input is controlled by climate and tectonics in the hinterland, and by eustatic sea level. Relative sea-level changes (eustasy and subsidence combined) modify water depth and current patterns. Sediment production and accumulation may vary significantly across the platform. Falling relative sea level (b) leads to emergence of shoals and peritidal areas, and creates restricted and low-energy lagoons. Rising relative sea level (c) reworks material of the previously exposed land and puts deeper areas below wave base
5.2 Facies evolution through space and time
Due to the combination of autocyclic and allocyclic processes controlling sedimentation as well as due to varying platform morphology created by differential subsidence and by irregular accumulation of carbonate it is very difficult to predict the distribution of facies through space and time. Oolitic and bioclastic shoals tend to accumulate on topographic highs where energy is high, but the location of these highs may shift over time. This is clearly seen in Fig. 9: for example, the shoal facies of elementary sequence 2 at Crozet is laterally and vertically replaced by lagoonal and peritidal facies, while at Poizat the high-energy facies appears in elementary sequence 5. The thinner elementary sequences within small-scale sequence 13 signaling low accommodation, the recurrent emergence features, and abundant quartz and clays at Rusel suggest a more proximal position on the platform, whereas at Yenne the beds of the same interval are thick with a more homogeneous facies, only few clays, and no emergence features. The relative abundance of brachiopods points to a more distal, open-marine environment at Yenne. However, there is great facies heterogeneity between these two sections, and no clear proximal–distal trend is visible. Consequently, neither within small-scale sequence 13 nor within the elementary sequences there is a discernible trend of systematic lateral or vertical facies evolution. This implies a highly dynamic platform system with various depositional environments that shifted constantly through space and time. The structuring of the sedimentary record thus stems rather from punctuations by sequence boundaries and maximum-flooding surfaces than from platform-wide facies changes.
Based on the large-scale time framework established for the Berriasian of the Jura platform (see above), it is assumed that small-scale sequence 13 formed in tune with the short eccentricity cycle and thus took about 100 kyr to accumulate. The elementary sequences, where identifiable, are interpreted as being related to the 20-kyr precession cycle. The distribution of time within an elementary sequence is highly irregular (Burgess and Wright 2003). If there is subaerial emergence at the sequence boundaries, non-deposition and reworking can take up much of the 20 kyr (Fig. 11; Sadler 1981, 1994). Intensely bioturbated intervals may indicate slower sedimentation rate and condensation, either in a maximum-flooding situation or around a sequence boundary when a lagoon is isolated behind an emergent barrier (Fig. 13). In the case of high-energy shoals, the entire thickness of an elementary sequence (e.g., elementary sequence 2 at Crozet; Fig. 9b) may have accumulated in a few months or years only and was preserved once the migration of the sand body stopped (Allen and Homewood 1984).
Autocyclically formed beds have of course no time attribute, and their duration can be estimated only by their position in relation to the orbitally-induced sequences. In the studied sections, autocyclic processes were probably involved in the creation of nodular beds by periodically flushing clays into shallow lagoons, thus creating localized limestone-marl alternations that were subsequently bioturbated. At Chapeau de Gendarme (Fig. 9b), the highstand of elementary sequence 2 is composed of three limestone beds separated by marls. Also in this case repetitive but localized input of clays must be postulated, independent of orbital control. Assuming that, during the general greenhouse climate of the Early Cretaceous, sea-level changes were more or less symmetrical (Read 1995), it can be estimated that this highstand interval lasted about 10 kyr (half a precession cycle). One of these beds would thus represent 3–4 kyr. Allocycles with shorter frequencies than those of the orbital cycles have been identified for example in the Triassic Latemar platform (Zühlke 2004) or in the Carboniferous of England (Tucker et al. 2009). However, these then should leave a platform-wide imprint, which is not the case in the studied Berriasian sections.
6 Conclusions
Based on the studied sections, the following conclusions can be drawn:
-
1.
The vertical facies evolution, the stacking pattern of small-scale and elementary depositional sequences, and the fact that some of these sequences can be correlated over the entire platform imply that high-frequency changes of relative sea level were an important controlling factor (although not the only one). An allocyclic control thus certainly was present. The chrono- and cyclostratigraphic time frame established in previous studies suggests that the small-scale sequences formed in tune with the 100-kyr short eccentricity cycle, and the elementary sequences with the 20-kyr precession cycle.
-
2.
Differential subsidence not only influenced accommodation space but also structured the shallow-marine platform. High-energy shoals accumulated preferentially on morphological highs, whereas lagoonal facies formed in morphological depressions. Siliciclastics originating from the hinterland were channeled through these depressions and thus have an irregular distribution on the platform, also depending on the local wave and current patterns. Lateral migration of shoals was driven by local factors such as tidal currents and storms. Consequently, the allocyclic signal was masked locally and at times by these autogenic or autocyclic processes.
-
3.
The combination of allocyclic and autocyclic processes created a complex lateral and vertical facies distribution over time. On the scale of elementary sequences (20 kyr), prediction of facies therefore is not possible. However, because accommodation is at least partly due to eustatic sea-level changes, some sequence-stratigraphic surfaces and intervals can be correlated over the entire platform and are, therefore, of allocyclic origin. They thus furnish the time frame within which the autocyclical processes took place.
-
4.
The boundaries of the small-scale sequences (100 kyr) are better marked in the sedimentary record through a stronger imprint of allocyclic processes, and the correlation of these sequences between sections is quite straightforward. Most of them can be correlated over tens of kilometres. Even intervals where elementary sequences are not recognizable can thus be constrained.
-
5.
The interplay between allocyclic, autocyclic, and episodic processes is different in each sedimentary system. Whether a process is recorded or not depends on the sensitivity of the depositional system to environmental changes (water depth, chemistry, energy, temperature). For example, on shallow platforms already small changes in water depth can create an important facies contrast, while in deeper water the diagnostic signal may be created by changes in oxygenation or bottom currents. In addition, the biosphere has an important influence on the depositional environment (especially in carbonate systems), and also the biosphere is affected by allocyclic and autocyclic factors. Consequently, these conclusions are valid for an Early Cretaceous, shallow, subtropical carbonate platform, but they may be useful for comparison with other shallow, subtropical carbonate platforms.
References
Abbink, O., Targarona, J., Brinkhus, H., & Visscher, H. (2001). Late Jurassic to earliest Cretaceous palaeoclimatic evolution of the southern North Sea. Global and Planetary Change, 30, 231–256.
Adams, R. D., & Grotzinger, J. P. (1996). Lateral continuity of facies and parasequences in Middle Cambrian platform carbonates, Carrara Formation, southeastern California, U.S.A. Journal of Sedimentary Research, 66, 1079–1090.
Allen, P. A., & Homewood, P. (1984). Evolution and mechanics of a Miocene tidal sandwave. Sedimentology, 31, 63–82.
Allenbach, R. P. (2002). The ups and downs of “Tectonic Quiescence”—recognizing differential subsidence in the epicontinental sea of the Oxfordian in the Swiss Jura Mountains. Sedimentary Geology, 150, 323–342.
Aurell, M., Robles, S., Bádenas, B., Rosales, I., Quesada, S., Meléndez, G., et al. (2003). Transgressive-regressive cycles and Jurassic palaeogeography of northeast Iberia. Sedimentary Geology, 162, 239–271.
Bádenas, B., Aurell, M., & Bosence, D. (2010). Continuity and facies heterogeneities of shallow carbonate ramp cycles (Sinemurian, Lower Jurassic, North-east Spain). Sedimentology, 57, 1021–1048.
Berger, A., Loutre, M. F., & Dehant, V. (1989). Astronomical frequencies for pre-Quaternary paleoclimate studies. Terra Nova, 1, 474–479.
Bosence, D., Procter, E., Aurell, M., Bel Kahla, A., Boudagher-Fadel, M., Casaglia, F., et al. (2009). A dominant tectonic signal in high-frequency, peritidal carbonate cycles? A regional analysis of Liassic platforms from western Tethys. Journal of Sedimentary Research, 79, 389–415.
Burgess, P. M. (2006). The signal and the noise: Forward modeling of allocyclic and autocyclic processes influencing peritidal carbonate stacking patterns. Journal of Sedimentary Research, 76, 962–977.
Burgess, P. M., & Wright, V. P. (2003). Numerical forward modeling of carbonate platform dynamics: An evaluation of complexity and completeness in carbonate strata. Journal of Sedimentary Research, 73, 637–652.
Carpentier, C., Lathuilière, B., & Ferry, S. (2010). Sequential and climatic framework of the growth and demise of a carbonate platform: Implications for the peritidal cycles (Late Jurassic, North-eastern France). Sedimentology, 57, 985–1020.
Catuneanu, O. (2006). Principles of sequence stratigraphy (375 pp). Amsterdam: Elsevier.
Cisne, J. L. (1986). Earthquakes recorded stratigraphically on carbonate platforms. Nature, 323, 320–322.
Clavel, B., Charollais, J., Busnardo, R., & Le Hégarat, G. (1986). Précisions stratigraphiques sur le Crétacé inférieur basal du Jura méridional. Eclogae Geologicae Helvetiae, 79, 319–341.
Cloyd, K. C., Demicco, R. V., & Spencer, R. J. (1990). Tidal channel, levee, and crevasse-splay deposits from a Cambrian tidal channel system: A new mechanism to produce shallowing-upward sequences. Journal of Sedimentary Petrology, 60, 73–83.
Colombié, C., & Rameil, N. (2007). Tethyan-to-boreal correlation in the Kimmeridgian using high-resolution sequence stratigraphy (Vocontian Basin, Swiss Jura, Boulonnais, Dorset). International Journal of Earth Sciences, 96, 567–591.
Cowan, C. A., & James, N. P. (1993). The interactions of sea-level change, terrigenous-sediment influx, and carbonate productivity as controls on Upper Cambrian Grand Cycles of western Newfoundland, Canada. Geological Society of America Bulletin, 105, 1576–1590.
Deconinck, J.-F. (1987). Minéraux argileux des faciès purbeckiens: Jura suisse et français, Dorset (Angleterre) et Boulonnais (France). Annales de la Société Géologique du Nord, 106, 285–297.
Dercourt, J., Gaetani, M., Vrielynck, B., Barrier, E., Biju-Duval, B., Brunet, M. F., et al. (2000). Atlas Peri-Tethys, palaeogeographical maps. Paris: CCGM/CGMW.
Détraz, H., & Mojon, P.-O. (1989). Evolution paléogéographique de la marge jurassienne de la Téthys du Tithonique-Portlandien au Valangien: corrélations biostratigraphique et séquentielle des faciès marins à continentaux. Eclogae Geologicae Helvetiae, 82, 37–112.
Drummond, C. N., & Wilkinson, B. H. (1993). Carbonate cycle stacking patterns and hierarchies of orbitally forced eustatic sea level change. Journal of Sedimentary Petrology, 63, 369–377.
Einsele, G., Ricken, W., & Seilacher, A. (1991). Cycles and events in stratigraphy—basic concepts and terms. In G. Einsele, W. Ricken, & A. Seilacher (Eds.), Cycles and events in stratigraphy (pp. 1–19). Berlin: Springer-Verlag.
Esteban, M., & Klappa, C. F. (1983). Subaerial exposure environments. In P. A. Scholle, D. G. Bebout, & C. H. Moore (Eds.), Carbonate depositional environments. American Association of Petroleum Geologists Memoir, 33, 1–54.
Eyles, N. (1993). Earth’s glacial record and its tectonic setting. Earth Science Reviews, 35, 1–248.
Fairbridge, R. W. (1976). Convergence of evidence on climatic change in ice ages. Annals of the New York Academy of Science, 91, 542–579.
Frakes, L. A., Francis, J. E., & Syktus, J. I. (1992). Climate modes of the Phanerozoic (270 pp). Cambridge: Cambridge University Press.
Ginsburg, R. N. (1971). Landward movement of carbonate mud: New model for regressive cycles in carbonates (abstract). American Association of Petroleum Geologists Bulletin, 55, 340.
Gornitz, V., Lebedeff, S., & Hansen, J. (1982). Global sea-level trend in the past century. Science, 215, 1611–1614.
Gradstein, F. M., Agterberg, F. P., Ogg, J. G., Hardenbol, J., van Veen, P., Thierry, J., & Huang, Z. (1995). A Triassic, Jurassic and Cretaceous time scale. In W. A. Berggren, D. V. Kent, M.-P. Aubry, & J. Hardenbol (Eds.), Geochronology, time scales, and global stratigraphic correlation. SEPM Special Publication, 54, 95–126.
Gradstein, F. M., Ogg, J. G., & Smith, A. G. (2004). A geologic time scale 2004 (589 pp). Cambridge: Cambridge University Press.
Gygi, R. A., & Persoz, F. (1986). Mineralostratigraphy, litho- and biostratigraphy combined in correlation of the Oxfordian (Late Jurassic) formations of the Swiss Jura range. Eclogae Geologicae Helvetiae, 79, 385–454.
Häfeli, C. (1966). Die Jura/Kreide-Grenzschichten im Bielerseegebiet (Kt. Bern). Eclogae Geologicae Helvetiae, 59, 565–695.
Hallam, A., Grose, J. A., & Ruffell, A. H. (1991). Palaeoclimatic significance of changes in clay mineralogy across the Jurassic-Cretaceous boundary in England and France. Palaeogeography, Palaeoclimatology, Palaeoecology, 81, 173–187.
Hallock, P., & Schlager, W. (1986). Nutrient excess and the demise of coral reefs and carbonate platforms. Palaios, 1, 389–398.
Haq, B. U., Hardenbol, J., & Vail, P. R. (1987). Chronology of fluctuating sea levels since the Triassic (250 million years ago to present). Science, 235, 1156–1167.
Hardenbol, J., Thierry, J., Farley, M. B., Jacquin, T., De Graciansky, P.-C., & Vail, P. R. (1998). Cretaceous sequence chronostratigraphy. In P.-C. De Graciansky, J. Hardenbol, T. Jacquin, & P. R. Vail, (Eds.), Mesozoic and Cenozoic sequence stratigraphy of European basins. SEPM Special Publication, 60, chart.
Hillgärtner, H. (1999). The evolution of the French Jura platform during the Late Berriasian to Early Valanginian: Controlling factors and timing (203 pp). GeoFocus, 1, Fribourg.
Hillgärtner, H., & Strasser, A. (2003). Quantification of high-frequency sea-level fluctuations in shallow-water carbonates: An example from the Berriasian-Valanginian (French Jura). Palaeogeography, Palaeoclimatology, Palaeoecology, 200, 43–63.
Jacquin, T., & De Graciansky, P.-C. (1998). Transgressive/regressive (second order) facies cycles: The effects of tectono-eustasy. In P.-C. De Graciansky, J. Hardenbol, T. Jacquin, & P. R. Vail (Eds.), Mesozoic and Cenozoic sequence stratigraphy of European basins. SEPM Special Publication, 60, 31–42.
Jan du Chêne, R., Busnardo, R., Charollais, J., Clavel, B., Deconinck, J.-F., Emmanuel, L., et al. (1993). Sequence-stratigraphic interpretation of Upper Tithonian-Berriasian reference sections in South-East France: A multidisciplinary approach. Centres de Recherche Exploration-Production Elf Aquitaine Bulletin, 17, 151–183.
Jiang, G., Christie-Blick, N., Kaufman, A. J., Banerjee, D. M., & Rai, V. (2003). Carbonate platform growth and cyclicity at a terminal Proterozoic passive margin, Infra Krol Formation and Krol Group, Lesser Himalaya, India. Sedimentology, 50, 921–952.
Jones, B., & Desrochers, A. (1992). Shallow platform carbonates. In R. G. Walker, & N. P. James (Eds.), Facies models, response to sea-level change (pp. 277–301). Geological Association of Canada.
Kendall, C. G., St, C., & Schlager, W. (1981). Carbonates and relative changes in sea level. Marine Geology, 44, 181–212.
Le Hégarat, G. (1973). Le Berriasien du Sud-Est de la France (576 pp). Documents du Laboratoire Géologique de la Faculté des Sciences Lyon, 43.
Lehmann, C., Osleger, D. A., & Montañez, I. P. (1998). Controls on cyclostratigraphy of Lower Cretaceous carbonates and evaporites, Cupido and Coahuila platforms, northeastern Mexico. Journal of Sedimentary Research, 68, 1109–1130.
Lehrmann, D. J., & Goldhammer, R. K. (1999). Secular variation in parasequence and facies stacking patterns of platform carbonates: A guide to application of stacking-patterns analysis in strata of diverse ages and settings. In P. M. Harris, A. H. Saller, & J. A. Simo (Eds.), Advances in carbonate sequence stratigraphy: Application to reservoirs, outcrops and models. SEPM Special Publication, 63, 187–225.
Lukasik, J. J., & James, N. P. (2003). Deepening-upward subtidal cycles, Murray Basin, South Australia. Journal of Sedimentary Research, 73, 653–671.
Martin, J., Paola, C., Abreu, V., Neal, J., & Sheets, B. (2009). Sequence stratigraphy of experimental strata under known conditions of differential subsidence and variable base level. American Association of Petroleum Geologists Bulletin, 93, 503–533.
Miall, A. D. (1997). The geology of stratigraphic sequences (433 pp). Berlin: Springer-Verlag.
Mitchum, R. M., & Van Wagoner, J. C. (1991). High-frequency sequences and their stacking patterns: Sequence-stratigraphic evidence of high-frequency eustatic cycles. Sedimentary Geology, 70, 131–160.
Mojon, P.-O. (2002). Les formations mésozoïques à charophytes (Jurassique moyen-Crétacé inférieur) de la marge téthysienne nord-occidentale (Sud-Est de la France, Suisse occidentale, Nord-Est de l’Espagne): Sédimentologie, micropalaéontologie, biostratigraphie (386 pp). Unpublishd PhD thesis, University of Grenoble.
Mojon, P.-O., & Strasser, A. (1987). Microfaciès, sédimentologie et mircopaléontologie du Purbeckien de Bienne (Jura suisse occidental). Eclogae Geologicae Helvetiae, 80, 37–58.
Montañez, I. P., & Osleger, D. A. (1993). Parasequence stacking patterns, third-order accommodation events, and sequence stratigraphy of Middle to Upper Cambrian platform carbonates, Bonanza King Formation, southern Great Basin. In R.G. Loucks & J. F. Sarg (Eds.), Carbonate sequence stratigraphy—Recent developments and applications. Amercian Association of Petroleum Geologists Memoir, 57, 305–326.
Mutterlose, J., Brumsack, H., Flögel, S., Hay, W., Klein, C., Langrock, U., et al. (2003). The Greenland-Norwegian Seaway: A key area for understanding Late Jurassic to Early Cretaceous paleoenvironments. Paleoceanography, 18, 1010–1035.
Ogg, J. G., Ogg, G., & Gradstein, F. M. (2008). The concise geologic time scale (177 pp). Cambridge: Cambridge University Press.
Osleger, D. (1991). Subtidal carbonate cycles: Implications for allocyclic vs autocyclic controls. Geology, 19, 917–920.
Pasquier, J.-B. (1995). Sédimentologie, stratigraphie séquentielle et cyclostratigraphie de la marge nord-téthysienne au Berriasien en Suisse occidentale (Jura, Helvétique et Ultrahelvétique; comparaison avec les séries de bassin des domaines Vocontien et Subbriançonnais) (274 pp). Unpublished PhD thesis, University of Fribourg.
Pasquier, J.-B., & Strasser, A. (1997). Platform-to-basin correlation by high-resolution sequence stratigraphy and cyclostratigraphy (Berriasian, Switzerland and France). Sedimentology, 44, 1071–1092.
Pittet, B., & Strasser, A. (1998). Long-distance correlations by sequence stratigraphy and cyclostratigraphy: Examples and implications (Oxfordian from the Swiss Jura, Spain, and Normandy). Geologische Rundschau, 86, 852–874.
Pittet, B., Strasser, A., & Mattioli, E. (2000). Depositional sequences in deep-shelf environments: A response to sea-level changes and shallow-platform carbonate productivity (Oxfordian, Germany and Spain). Journal of Sedimentary Research, 70, 392–407.
Posamentier, H. W., Jervey, M. T., & Vail, P. R. (1988). Eustatic controls on clastic deposition I—Conceptual framework. In C. E. Wilgus, B. S. Hastings, C. G. St. C. Kendall, H. W. Posamentier, C. A. Ross, & J. C. Van Wagoner (Eds.), Sea-level changes—an integrated approach. SEPM Special Publication, 42, 109–124.
Pratt, B. R., & James, N. P. (1986). The St George Group (Lower Ordovician) of western Newfoundland: Tidal flat island model for carbonate sedimentation in shallow epeiric seas. Sedimentology, 33, 313–343.
Pratt, B. R., & James, N. P. (1992). Peritidal carbonates. In R. G. Walker & N. P. James (Eds.), Facies models, response to sea-level change (pp. 303–322). Geological Association of Canada.
Rankey, E. C. (2002). Spatial patterns of sediment accumulation on a Holocene carbonate tidal flat, northwest Andros Island, Bahamas. Journal of Sedimentary Research, 72, 591–601.
Read, J. F. (1995). Overview of carbonate platform sequences, cycle stratigraphy and reservoirs in greenhouse and ice-house worlds. In J. F. Read, C. Kerans, L. J. Weber, J. F. Sarg, & F. M. Wright (Eds.), Milankovitch sea-level changes, cycles, and reservoirs on carbonate platforms in greenhouse and ice-house worlds. SEPM Short Course, 35, 1–102.
Read, J. F., Grotzinger, J. P., Bova, J. A., & Koerschner, W. F. (1986). Models for generation of carbonate cycles. Geology, 14, 107–110.
Sadler, P. M. (1981). Sediment accumulation rates and the completeness of stratigraphic sections. Journal of Geology, 89, 569–584.
Sadler, P. M. (1994). The expected duration of upward-shallowing peritidal carbonate cycles and their terminal hiatuses. Geological Society of America Bulletin, 106, 791–802.
Sami, T. T., & James, N. P. (1994). Peritidal carbonate platform growth and cyclicity in an Early Proterozoic foreland basin, upper Pethei Group, northwest Canada. Journal of Sedimentary Research, B64, 111–131.
Sandulli, R., & Raspini, A. (2004). Regional to global correlation of Lower Cretaceous (Hauterivian-Barremian) shallow-water carbonates of the southern Apennines (Italy) and Dinarides (Montenegro), southern Tethyan margin. Sedimentary Geology, 165, 117–153.
Satterley, A. K. (1996). The interpretation of cyclic successions of the Middle and Upper Triassic of the Northern and Southern Alps. Earth Science Reviews, 40, 181–207.
Sattler, U., Immenhauser, A., Hillgärtner, H., & Esteban, M. (2005). Characterization, lateral variability and lateral extent of discontinuity surfaces on a carbonate platform (Barremian to Lower Aptian, Oman). Sedimentology, 52, 339–361.
Schlager, W. (1993). Accommodation and supply—a dual control on stratigraphic sequences. Sedimentary Geology, 86, 111–136.
Schulz, M., & Schäfer-Neth, C. (1997). Translating Milankovitch climate forcing into eustatic fluctuations via thermal deep water expansion: A conceptual link. Terra Nova, 9, 228–231.
Smith, L. B., & Read, J. F. (2001). Discrimination of local and global effects on Upper Mississippian stratigraphy, Illinois Basin, U.S.A. Journal of Sedimentary Research, 71, 985–1002.
Steinhauser, N., & Lombard, A. (1969). Définition de nouvelles unités lithostratigraphiques dans le Crétacé inférieur du Jura méridional (France). Comptes Rendus de la Société de Physique et d’Histoire Naturelle Genève, 4, 100–113.
Strasser, A. (1984). Black-pebble occurrence and genesis in Holocene carbonate sediments (Florida Keys, Bahamas, and Tunisia). Journal of Sedimentary Petrology, 54, 1097–1109.
Strasser, A. (1988). Shallowing-upward sequences in Purbeckian peritidal carbonates (lowermost Cretaceous, Swiss and French Jura Mountains). Sedimentology, 35, 369–383.
Strasser, A. (1991). Lagoonal-peritidal sequences in carbonate environments: Autocyclic and allocyclic processes. In G. Einsele, W. Ricken, & A. Seilacher (Eds.), Cycles and events in stratigraphy (pp. 709–721). Berlin: Springer-Verlag.
Strasser, A., Hilgen, F. J., & Heckel, P. H. (2006). Cyclostratigraphy—Concepts, definitions and applications. Newsletters on Stratigraphy, 42, 75–114.
Strasser, A., & Hillgärtner, H. (1998). High-frequency sea-level fluctuations recorded on a shallow carbonate platform (Berriasian and Lower Valanginian of Mount Salève, French Jura). Eclogae Geologicae Helvetiae, 91, 375–390.
Strasser, A., Hillgärtner, H., Hug, W., & Pittet, B. (2000). Third-order depositional sequences reflecting Milankovitch cyclicity. Terra Nova, 12, 303–311.
Strasser, A., Hillgärtner, H., & Pasquier, J.-B. (2004). Cyclostratigraphic timing of sedimentary processes: An example from the Berriasian of the Swiss and French Jura Mountains. In B. D’Argenio, A. G. Fischer, I. Premoli Silva, H. Weissert, & V. Ferreri (Eds.), Cyclostratigraphy: Approaches and case histories. SEPM Special Publication, 81, 135–151.
Strasser, A., Pittet, B., Hillgärtner, H., & Pasquier, J.-B. (1999). Depositional sequences in shallow carbonate-dominated sedimentary systems: Concepts for a high-resolution analysis. Sedimentary Geology, 128, 201–221.
Strasser, A., & Samankassou, E. (2003). Carbonate sedimentation rates today and in the past: Holocene of Florida Bay, Bahamas, and Bermuda vs Upper Jurassic and Lower Cretaceous of the Jura Mountains (Switzerland and France). Geologia Croatica, 56, 1–18.
Tipper, J. C. (1997). Modeling carbonate platform sedimentation—Lag comes naturally. Geology, 25, 495–498.
Tresch, J. (2007). History of a Middle Berriasian transgression (France, Switzerland, and southern England) (271 pp). GeoFocus, 16, Fribourg.
Tresch, J., & Strasser, A. (2010). History of a Middle Berriasian transgression on the Jura carbonate platform: Revealed by high-resolution sequence- and cyclostratigraphy (Switzerland and France). International Journal of Earth Sciences, 99, 139–163.
Trümpy, R. (1980). Geology of Switzerland—A guide-book. Part A: An outline of the geology of Switzerland (104 pp). Basel: Wepf.
Tucker, M. E., Gallagher, J., & Leng, M. J. (2009). Are beds in shelf carbonates millennial-scale cycles? An example from the mid-Carboniferous of northern England. Sedimentary Geology, 214, 19–34.
Vail, P. R., Audemard, F., Bowman, S. A., Eisner, P. N., & Perez-Cruz, C. (1991). The stratigraphic signatures of tectonics, eustacy and sedimentology—An overview. In G. Einsele, W. Ricken, & A. Seilacher (Eds.), Cycles and events in stratigraphy (pp. 617–659). Berlin: Springer-Verlag.
Valdes, P. J., Sellwood, B. W., & Price, G. D. (1995). Modelling Late Jurassic Milankovitch climate variations. In M. R. House & A. S. Gale (Eds.), Orbital forcing timescales and cyclostratigraphy. Geological Society London Special Publication, 85, 115–132.
Weedon, G. (2003). Time-series analysis and cyclostratigraphy (259 pp). Cambridge: Cambridge University Press.
Wildi, W., Funk, H., Loup, B., Amato, E., & Huggenberger, P. (1989). Mesozoic subsidence history of the European marginal shelves of the alpine Tethys (Helvetic realm, Swiss Plateau and Jura). Eclogae Geologicae Helvetiae, 82, 817–840.
Wilkinson, B. H., Diedrich, N. W., & Drummond, C. N. (1996). Facies successions in peritidal carbonate sequences. Journal of Sedimentary Research, 66, 1065–1078.
Wright, V. P., & Burgess, P. M. (2005). The carbonate factory continuum, facies mosaics and microfacies: An appraisal of some of the key concepts underpinning carbonate sedimentology. Facies, 51, 17–23.
Yang, W., Kominz, M. A., & Major, R. P. (1998). Distinguishing the roles of autogenic and allogenic processes in cyclic sedimentation, Cisco Group (Virgilian and Wolfcampian), north-central Texas. Geological Society of America Bulletin, 110, 1333–1353.
Ziegler, P. A. (1988). Evolution of the Arctic—North Atlantic and the western Tethys (198 pp). American Association of Petroleum Geologists Memoir, 43.
Zühlke, R. (2004). Integrated cyclostratigraphy of a model Mesozoic carbonate platform—The Latemar (Middle Triassic, Italy). In B. D’Argenio, A. G. Fischer, I. Premoli Silva, H. Weissert, & V. Ferreri (Eds.), Cyclostratigraphy: Approaches and case histories. SEPM Special Publication, 81, 183–211.
Acknowledgments
This work is based on the PhD thesis of Jonas Tresch, which was financed by the University of Fribourg and the Swiss National Science Foundation (project No. 2000-067736.02). The support by these institutions is gratefully acknowledged. We thank Peter Burgess, Dan Bosence, and David Osleger for their helpful comments on an early version of the manuscript, and Maurice Tucker and Heiko Hillgärtner for their constructive reviews of the present version. Daniel Marty is thanked for the efficient handling of the manuscript.
Author information
Authors and Affiliations
Corresponding author
Additional information
Editorial handling: Daniel Marty.
Rights and permissions
About this article
Cite this article
Tresch, J., Strasser, A. Allogenic and autogenic processes combined in the formation of shallow-water carbonate sequences (Middle Berriasian, Swiss and French Jura Mountains). Swiss J Geosci 104, 299–322 (2011). https://doi.org/10.1007/s00015-011-0064-2
Received:
Accepted:
Published:
Issue Date:
DOI: https://doi.org/10.1007/s00015-011-0064-2